
Some referees reach for their pocket more often than others. Over a full season, those differences are large enough to matter when you look at a match: the same fixture can produce very different card counts depending on who is in charge. We ranked every referee who officiated at least ten Premier League matches in 2025-26.
The ranking
| Referee | Matches | Yellow cards per game | Red cards (total) | Fouls per game |
|---|---|---|---|---|
| S Attwell | 25 | 4.60 | 2 | 21.7 |
| M Salisbury | 14 | 4.36 | 0 | 21.9 |
| D England | 23 | 4.30 | 3 | 22.0 |
| R Jones | 18 | 4.17 | 0 | 21.1 |
| T Bramall | 22 | 4.05 | 2 | 21.5 |
| S Hooper | 15 | 4.00 | 2 | 23.3 |
| C Kavanagh | 30 | 3.97 | 3 | 22.5 |
| A Taylor | 31 | 3.94 | 2 | 20.5 |
| P Bankes | 22 | 3.82 | 4 | 22.5 |
| S Barrott | 24 | 3.71 | 1 | 19.3 |
| J Brooks | 12 | 3.67 | 3 | 20.9 |
| J Gillett | 22 | 3.59 | 1 | 19.8 |
| P Tierney | 12 | 3.33 | 2 | 20.2 |
| A Madley | 21 | 3.24 | 4 | 22.9 |
| M Oliver | 29 | 3.17 | 2 | 22.7 |
| T Harrington | 11 | 3.00 | 1 | 20.0 |
| C Pawson | 21 | 2.67 | 2 | 21.7 |
| League average | 380 | 3.75 | 39 | 21.6 |
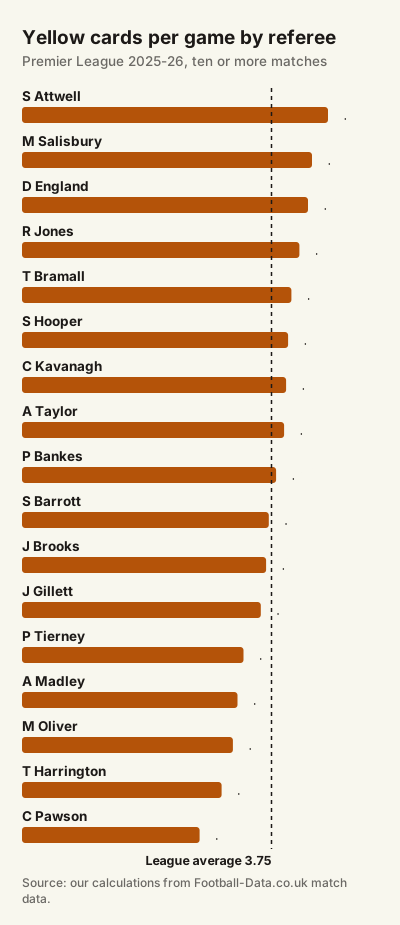
Note: Our own calculations from the match data published by Football-Data.co.uk, which records the referee, cards and fouls for each match. Names as recorded in the data. Six referees with fewer than ten matches are not listed.
What stands out
- The spread is wide. The referee at the top showed 4.60 yellows per game, the one at the bottom 2.67: a difference of almost two cards per match.
- Fouls do not explain it. Fouls per game vary much less than cards. Some referees with average foul counts show far more cards, which points to a different threshold for cautioning rather than more physical matches.
- Red cards are too rare to rank. With 0 to 4 reds per referee over a season, the differences are mostly chance.
How to use this: Cards per foul is a useful way to look at a referee's style. A referee who awards the same number of fouls but shows more cards is setting a lower threshold for a caution.
Why a referee's average is not the whole story
Referees are not assigned at random. The most experienced officials tend to take the biggest and most heated matches, which can push their averages up. Others get more routine fixtures. A referee's numbers mix their own style with the type of match they are given.
Example: Invented figures to show the effect. Two referees have the same strictness. One takes eight derbies and title deciders out of 25 matches, the other two. The first will usually end the season with more cards per game, even though both would book the same player for the same foul.
How to use these numbers
- Look at the sample. Ten or more matches is the minimum we show; thirty is far more reliable.
- Compare with the league average rather than looking at the raw number.
- Consider the fixture. A strict referee in a calm match may still produce few cards.
- Check the season. Guidance to referees changes, and so do averages. See Yellow Cards per Game, Season by Season.
Put any referee's season totals into the referee profile calculator to get per-match rates and a comparison with the league, and read How to Analyze a Referee Before a Match for the full method.
Watch out: Referee averages describe past matches. They are useful context, not a prediction of the next game, and single-match card counts vary a great deal.
- In 2025-26, referees with ten or more matches ranged from 4.60 to 2.67 yellow cards per game, against a league average of 3.75.
- Fouls vary much less than cards, so differences mostly reflect each referee's threshold for cautions.
- Assignments are not random: big matches can inflate a senior referee's average.
Sources
- English football results and data — Football-Data.co.uk
- Laws of the Game: Law 12, fouls and misconduct — IFAB