
Corner counts are one of the most visible statistics in football, and one of the most misread. Over a season, though, they say something real about how teams play: who pins opponents back and who spends matches defending. Here is the full 2025-26 Premier League table of corners won and conceded per game.
The table
| Team | Corners won per game | Corners conceded per game | Difference |
|---|---|---|---|
| Man City | 6.50 | 3.82 | +2.68 |
| Liverpool | 6.11 | 4.39 | +1.71 |
| Newcastle | 6.08 | 4.92 | +1.16 |
| Chelsea | 6.08 | 4.32 | +1.76 |
| Arsenal | 5.68 | 3.37 | +2.32 |
| Bournemouth | 5.58 | 5.32 | +0.26 |
| Tottenham | 5.47 | 4.68 | +0.79 |
| Nott'm Forest | 5.24 | 4.82 | +0.42 |
| Aston Villa | 5.24 | 4.92 | +0.32 |
| Fulham | 4.95 | 5.53 | −0.58 |
| West Ham | 4.92 | 6.11 | −1.18 |
| Brighton | 4.87 | 4.82 | +0.05 |
| Brentford | 4.79 | 5.37 | −0.58 |
| Man United | 4.79 | 4.89 | −0.11 |
| Leeds | 4.42 | 5.08 | −0.66 |
| Everton | 4.29 | 5.11 | −0.82 |
| Crystal Palace | 4.21 | 5.24 | −1.03 |
| Sunderland | 3.71 | 5.29 | −1.58 |
| Burnley | 3.63 | 6.00 | −2.37 |
| Wolves | 3.42 | 6.00 | −2.58 |
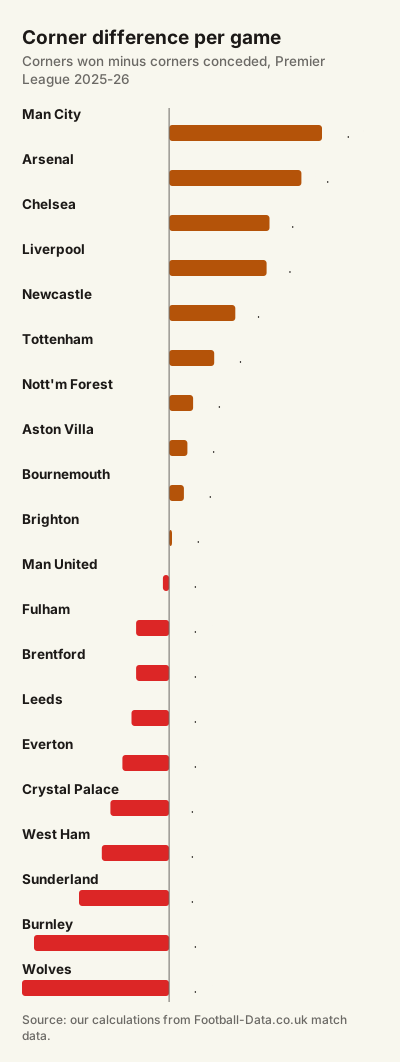
Note: Our own calculations from Football-Data.co.uk match data for all 380 matches of 2025-26. The league average was 10.0 corners per match, 5.39 for home teams and 4.60 for away teams.
What the table shows
- Corners follow territory. The top of the "won" column is dominated by teams that spend long spells in the opponent's half: Manchester City, Liverpool, Chelsea, Newcastle and champions Arsenal.
- The bottom mirrors the table. Burnley and Wolves, the two clubs relegated with the fewest points, won the fewest corners and conceded six per game.
- Arsenal conceded the fewest. Just 3.37 corners against per game, consistent with the league's best defence.
How to use this: The difference column is the most informative: it combines how often a team attacks into the box with how often it is forced to defend its own. It tracks league position surprisingly well.
Corners are not goals
A high corner count does not mean a team scores a lot from corners. Across eleven Premier League seasons, the link between a team's corners in a match and its goals in that match was very weak, much weaker than the link between shots and goals. We look at that in Do Corners Lead to Goals?.
Example: A reading of the table. Bournemouth won 5.58 corners per game, more than Aston Villa, but also conceded 5.32. Their difference of +0.26 says their matches were open at both ends, which fits a season in which they drew 18 times.
How to use corner data
- Use per-game figures, not totals, especially early in a season.
- Look at both columns. A team can win many corners and still concede many.
- Split home and away. Home teams won about 0.8 more corners per match than away teams in 2025-26.
- Consider game state. Teams chasing a game win more corners late on.
Corner counts are part of the picture we use when looking at referees and match profiles; see the referee profile calculator for the card side.
Watch out: Single-match corner counts vary a lot. A season average describes a style; it does not predict one match with any precision.
- Manchester City won the most corners per game in 2025-26 (6.50); Wolves the fewest (3.42).
- The corner difference per game tracks team quality and territory closely.
- Corners say more about dominance than about goals.
Sources
- English football results and data — Football-Data.co.uk
- 2025–26 Premier League — Wikipedia: final table