
A red card is the most dramatic decision a referee can make, and it changes matches. But by how much? We looked at every Premier League match from 2015-16 to 2025-26 and compared results in matches with and without a sending-off. The headline is striking, but reading it correctly needs care.
The results
| Situation | Matches | Home win | Draw | Away win |
|---|---|---|---|---|
| No red cards | 3,719 | 44.6% | 23.6% | 31.8% |
| Only the home team had a player sent off | 201 | 23.9% | 21.4% | 54.7% |
| Only the away team had a player sent off | 242 | 59.1% | 26.0% | 14.9% |
| Both teams had a player sent off | 18 | 27.8% | 27.8% | 44.4% |
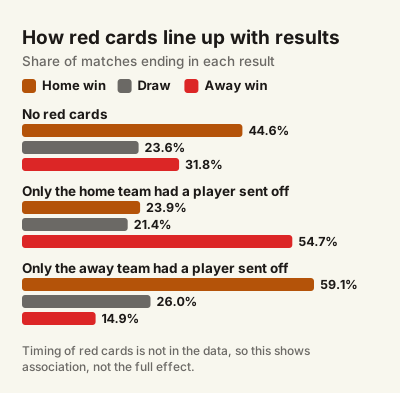
Note: Our own calculations from Football-Data.co.uk match data, 4,180 matches. The data records how many red cards each team received, but not when, so the table cannot separate early dismissals from late ones.
What the numbers suggest
When only the home team had a player sent off, its win rate fell from 44.6% to 23.9%, and the away side won more than half of those matches. When only the away team lost a player, the home win rate rose to 59.1% and away wins fell to 14.9%.
About one match in nine featured at least one red card over this period: 461 of 4,180.
Why this overstates the effect
It is tempting to read the table as "a red card cuts your chance of winning in half". The real effect is smaller than that, for two reasons:
- Timing. A red card in the 88th minute changes little; one in the 10th changes a lot. The table mixes them together.
- Reverse causation. Teams that are losing, under pressure or chasing the game are more likely to commit the kind of fouls that lead to red cards. Some of these teams were going to lose anyway, and the red card is partly a symptom.
How to use this: A good way to measure the effect of a red card is to compare the expected result just before the dismissal with the final result. That requires minute-by-minute data, which is why research on the topic uses event data rather than final scores.
What we can still say
- A sending-off is strongly associated with worse results for the team that receives it.
- The association holds for both home and away teams.
- When both teams lose a player, the sample is too small to say much: only 18 matches.
Example: How timing changes the picture, with invented figures. A team leading 1–0 that loses a player in the 85th minute will often still win. The same team losing a player in the 15th minute at 0–0 faces 75 minutes with ten men. In the table, both cases count the same.
Red cards are rare, and that matters
With roughly 40 to 60 red cards per Premier League season in this period, any single team or referee sees only a handful. That is why red-card rates per referee are too noisy to rank, as we note in Premier League Referees Ranked by Cards per Game.
Watch out: Red cards are among the least predictable events in football. Treat any claim about which matches "will" have a sending-off with deep scepticism.
For yellow and red card trends by season, see Yellow Cards per Game, Season by Season.
- From 2015-16 to 2025-26, home teams that had a player sent off won only 23.9% of matches; away teams in the same situation won 14.9%.
- About one Premier League match in nine had at least one red card.
- Without timing data, the table overstates the effect: teams already losing are more likely to be sent off.
Sources
- English football results and data — Football-Data.co.uk
- Laws of the Game: Law 12, fouls and misconduct — IFAB