
Away teams are booked more often than home teams. That pattern is well known, but its cause is not obvious: do away players commit more fouls, or do referees respond to the crowd? The seasons when Premier League matches were played behind closed doors offer an unusually clean test. We compared every match from 2015-16 to 2025-26.
With and without fans
| Period | Matches | Home yellows per game | Away yellows per game | Gap | Home fouls | Away fouls |
|---|---|---|---|---|---|---|
| With fans | 3,728 | 1.66 | 1.88 | +0.22 | 10.46 | 10.94 |
| Mostly behind closed doors (17 Jun 2020 – 16 May 2021) | 452 | 1.43 | 1.43 | 0.00 | 11.24 | 10.74 |
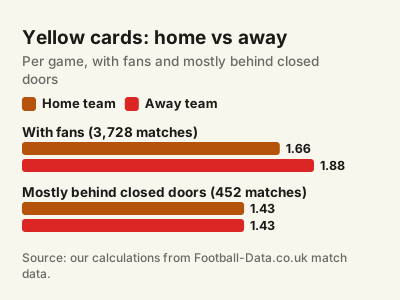
Note: Our own calculations from Football-Data.co.uk match data. The closed-doors period is approximate: a small number of matches in that window had limited crowds.
What changed
With fans in the stadium, away teams received 0.22 more yellow cards per game than home teams. Without fans, the gap disappeared completely: 1.43 yellows each.
The foul numbers add an interesting detail. Without crowds, home teams were penalised for slightly more fouls than away teams (11.24 against 10.74), the opposite of the pattern with fans.
How to use this: If away teams were simply more reckless, the gap in cards should have survived the empty stadiums. It did not. That points to the crowd influencing decisions, not just behaviour on the pitch.
The research agrees
A study of 4,844 matches in 15 European leagues, published in 2021, compared matches with and without fans during the pandemic. Without crowds, referees awarded fewer fouls and fewer yellow cards against away teams, and home advantage in results roughly halved. Our Premier League figures show the same pattern on cards, and an even larger change.
Is it the referee's fault?
Not necessarily in any deliberate sense. Referees make split-second judgements, and crowd noise is a form of information: a loud reaction can make a challenge seem worse than it was. VAR does not review yellow cards, so it cannot correct this effect.
Why it matters for analysis
- Split cards by home and away. A team's away card rate is not the same as its home rate.
- Use the right baseline. When a referee profile is compared with the league average, compare home and away cards separately if you can.
- Expect the effect to vary. Crowd size, atmosphere and the importance of the match all play a part.
Example: Applying the gap, with invented figures. If a team averages 1.7 yellows per game overall, a reasonable starting point is a little lower at home and a little higher away, for example around 1.6 at home and 1.8 away, before looking at the referee and the opponent.
Watch out: The closed-doors sample, 452 matches, is large enough to show a clear change but not to measure it precisely. Treat the exact figures as indicative.
For referee-by-referee numbers, see Premier League Referees Ranked by Cards per Game, and turn any referee's totals into rates with the referee profile calculator.
- With fans, Premier League away teams received 0.22 more yellow cards per game than home teams.
- In the mostly closed-doors period of 2020-21, the gap fell to zero.
- The evidence points to crowd influence on refereeing decisions, consistent with European research.
Sources
- English football results and data — Football-Data.co.uk
- Home advantage during the COVID-19 pandemic: analyses of European football leagues — McCarrick and others, 2021