
Card counts are not fixed features of football. They move with refereeing guidance, the style of play and even the presence of crowds. Eleven seasons of Premier League data show how much: yellow cards per match ranged from 2.87 to 4.17 in this period, a difference of almost one and a half cards per game.
Season by season
| Season | Yellow cards per game | Red cards (season total) | Fouls per game | Corners per game |
|---|---|---|---|---|
| 2015-16 | 3.10 | 59 | 21.5 | 10.8 |
| 2016-17 | 3.63 | 41 | 22.7 | 10.4 |
| 2017-18 | 3.04 | 39 | 20.7 | 10.3 |
| 2018-19 | 3.21 | 47 | 20.5 | 10.3 |
| 2019-20 | 3.35 | 45 | 21.5 | 10.7 |
| 2020-21 | 2.87 | 46 | 21.8 | 10.2 |
| 2021-22 | 3.40 | 43 | 20.2 | 10.4 |
| 2022-23 | 3.59 | 28 | 21.5 | 10.1 |
| 2023-24 | 4.17 | 57 | 22.1 | 10.8 |
| 2024-25 | 4.05 | 52 | 22.1 | 10.3 |
| 2025-26 | 3.75 | 39 | 21.6 | 10.0 |
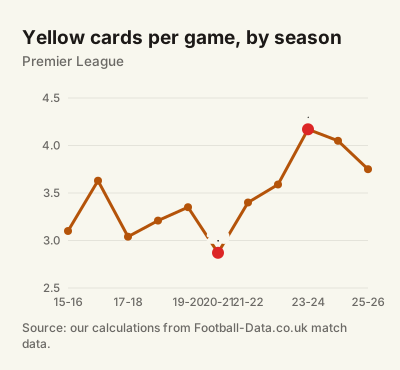
Note: Our own calculations from Football-Data.co.uk match data, 380 matches per season.
Three things that stand out
1. Fouls are stable, cards are not. Fouls per game stayed between about 20 and 23 throughout. Yellow cards moved much more. The number of fouls on the pitch did not change much; the decision to book them did.
2. The lowest season had no crowds. 2020-21, played mostly behind closed doors, had the fewest yellow cards per game (2.87). It is also the season in which the usual gap between home and away bookings vanished, as we show in Home and Away Cards: What Empty Stadiums Revealed.
3. 2023-24 was a peak. Before that season, the Premier League, the Football League, the FA and the referees' body agreed to clamp down on dissent and time-wasting. According to Opta Analyst, 216 yellow cards were shown for dissent in 2023-24, a record and 130 more than the season before. Overall bookings rose to 4.17 per game, the highest in this period.
How to use this: When refereeing guidance changes, historical averages stop describing the present. A referee's card rate from three seasons ago may be a poor guide today.
After the peak
Bookings stayed high in 2024-25 (4.05 per game) and eased in 2025-26 (3.75), still well above the pre-2023 seasons. Whether this reflects players adapting to the stricter approach, a softer application of it or simply normal variation, the data alone cannot say.
Red cards move independently
Red cards ranged from 28 in a season (2022-23) to 59 (2015-16), and their totals do not follow yellow cards closely. They are rare enough that random variation dominates season-to-season changes.
Example: How to adjust for a change in guidance, with invented figures. A referee averaged 3.2 yellows per game in a season when the league average was 3.4. In a season with a league average of 4.1, a similar relative strictness would suggest about 3.9 per game, not 3.2.
Watch out: Season averages hide large differences between matches and referees. Use them as background, and compare referees with the average of the same season.
For referee comparisons within a season, see Premier League Referees Ranked by Cards per Game and the referee profile calculator.
- Premier League yellow cards per game ranged from 2.87 (2020-21) to 4.17 (2023-24) between 2015-16 and 2025-26.
- Fouls stayed stable; the change came from how often fouls and dissent were punished.
- The 2023-24 crackdown on dissent produced a record number of dissent bookings.
Sources
- English football results and data — Football-Data.co.uk
- New Premier League records on the cards — Opta Analyst