
"They had twelve corners, they must have been all over them." It sounds logical: more corners, more pressure, more goals. The data says otherwise. We looked at every Premier League match from 2015-16 to 2025-26, 4,180 matches, and the relationship between corners and goals turns out to be surprisingly weak.
The numbers
For each team in each match, we compared corners won with goals scored, and did the same for shots:
| Comparison (team per match) | Correlation |
|---|---|
| Corners won and goals scored | 0.07 |
| Shots and goals scored | 0.35 |
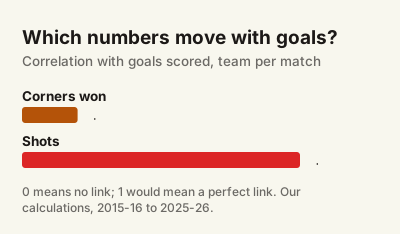
Note: Our own calculations from Football-Data.co.uk data for 4,180 matches. Correlation runs from −1 to 1; values close to 0 mean the two numbers barely move together.
A correlation of 0.07 means that knowing how many corners a team won tells you almost nothing about how many goals it scored in that match. Shots, by comparison, show a link about five times stronger.
Who wins when corners are uneven?
In matches where one team won more corners than the other:
- the team with more corners won 42.0% of the time;
- the team with fewer corners won 34.1%;
- the rest were draws.
The team with more corners does better, but only modestly. And part of that edge comes from simply being the better team, which also wins more corners.
How to use this: Corners are partly a by-product of losing. Teams that fall behind push forward, put crosses into the box and win corners, while the leading team defends deep. That is why a corner count can rise while a team is losing.
Why corners convert so rarely
Studies of corner kicks have consistently found that only a small share become goals: an analysis of the 570 corners at the 2022 World Cup found a conversion rate of 2.6%. Even a team that wins eight corners a match should expect to score from one only every few games.
Example: A worked illustration with the World Cup rate. At 2.6% per corner, eight corners produce about 0.21 goals on average. Over five matches, that is roughly one goal from forty corners.
What corners do tell you
- Territory. Over a season, teams that win many more corners than they concede usually spend more time in the opponent's half. See Which Teams Win the Most Corners?.
- Attacking style. Teams that cross a lot win more corners than teams that attack through the middle.
- Set-piece opportunity. For teams with strong aerial players and rehearsed routines, corners are a real source of goals, even if the average is low.
Better indicators of pressure
If you want to know which team created more danger, look at shots, shots on target and, where available, expected goals (xG), which values each chance by its quality. Corners are best read alongside those numbers, not instead of them.
Watch out: Corner counts and goals are both noisy in single matches. Patterns only become visible across hundreds of matches, which is why we used eleven seasons.
For the card side of match profiles, see the referee profile calculator.
- Across 4,180 Premier League matches, corners and goals were only weakly linked (correlation 0.07), far less than shots and goals (0.35).
- Teams with more corners won 42.0% of uneven matches; teams with fewer, 34.1%.
- Corners measure territory and style more than scoring.
Sources
- English football results and data — Football-Data.co.uk
- FIFA World Cup 2022 Qatar corner kicks: an analysis on effectiveness — Solent University, Qeios, 2024